
Tech
Line graph vs scatter plot: when to use

Published
3 hours agoon
By
Realty Fact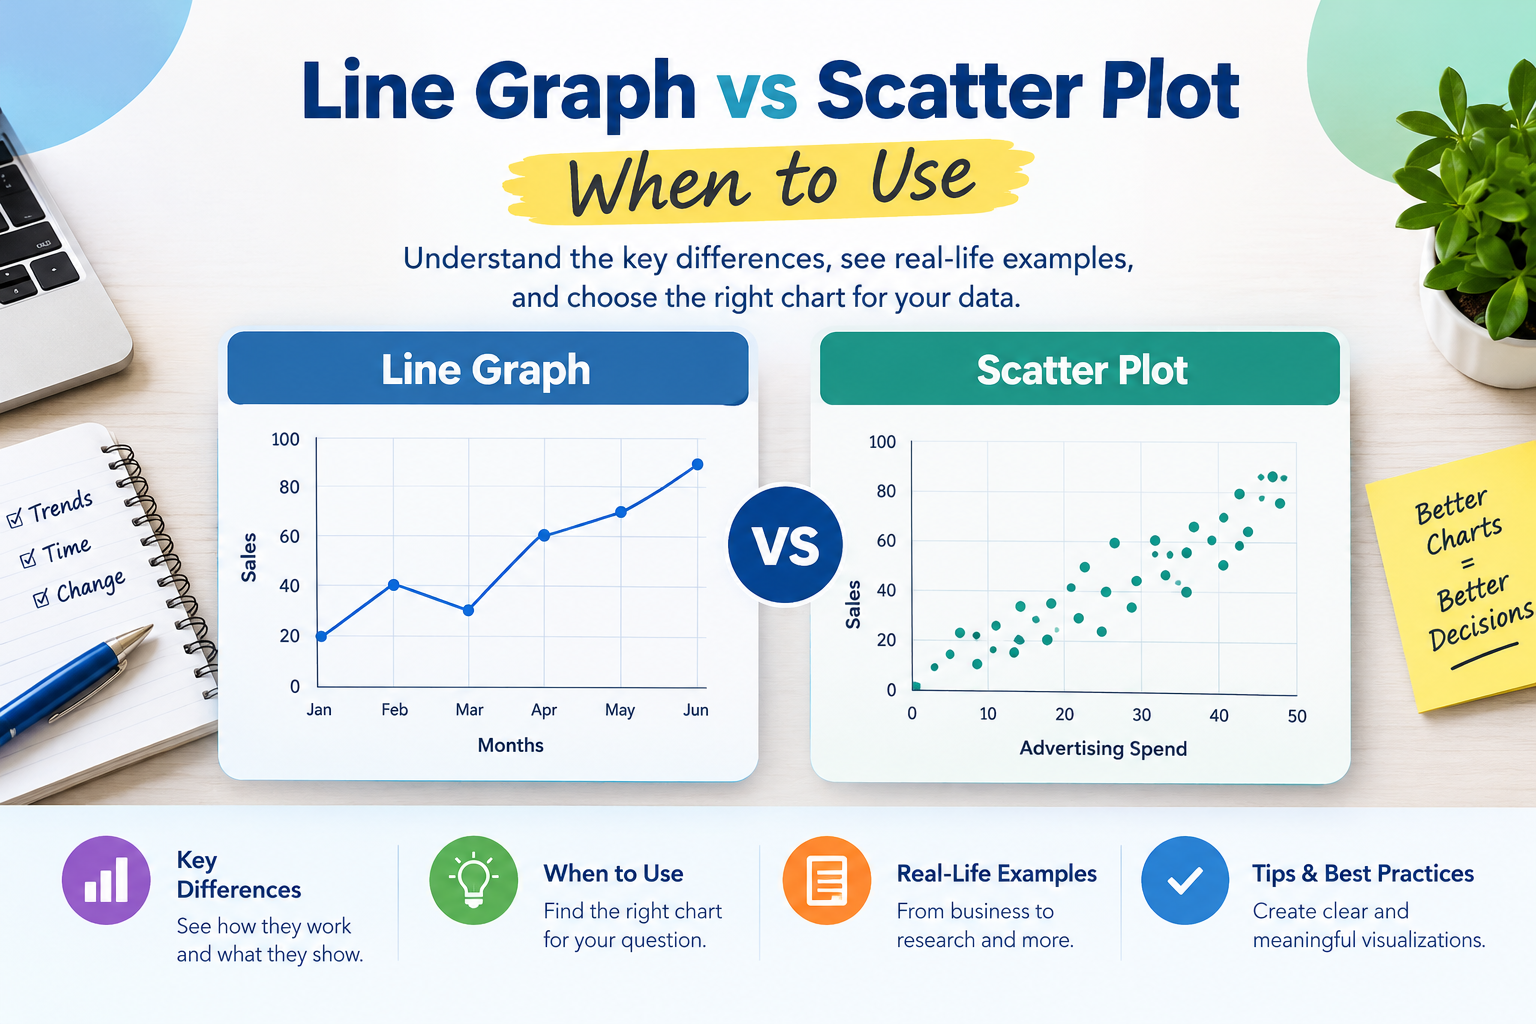
Choosing the right chart can make data easier to understand and help readers identify meaningful patterns. When comparing a line graph vs scatter plot when to use, the most important factor is the type of relationship you want to show. Both charts help visualize numerical data, but they serve different purposes.
A line graph is generally useful for showing how values change over time or across an ordered sequence. A scatter plot is better for examining the relationship between two numerical variables and identifying correlations, clusters, and unusual observations. Choosing the wrong chart can make a pattern difficult to interpret or suggest a connection that the data does not support.
Understanding line graph vs scatter plot when to use each is valuable for students, researchers, business analysts, educators, and anyone who works with data. The right choice depends on your variables, the questions you want to answer, and the message your visualization needs to communicate.
This article explains how both charts work, how they differ, when to use each one, and how to select the best option for different data analysis situations.
Table of Contents
ToggleWhat Is a Line Graph?
A line graph is a data visualization that displays values as points connected by straight lines. It is commonly used to show changes over time, making it easier to see whether a value is increasing, decreasing, or remaining relatively stable.
The horizontal axis usually represents time or another ordered variable, while the vertical axis represents the numerical value being measured.
For example, a business might use a line graph to track monthly revenue. Connecting the monthly values helps readers understand how revenue changes throughout the year and whether a particular period shows growth or decline.
Common Uses of Line Graphs
Line graphs are useful when the order of observations matters and connecting consecutive values communicates a meaningful progression.
Typical applications include:
- Tracking daily website visitors or monthly sales
- Comparing temperature changes throughout a week
- Monitoring stock prices over a selected period
- Showing changes in population over several years
- Measuring website traffic before and after a marketing campaign
- Comparing multiple trends on the same chart
A line graph can also contain multiple lines. For instance, a retailer could compare monthly sales across three product categories to identify seasonal patterns and differences in performance.
When Connecting Data Points Makes Sense
Connecting points is appropriate when the data represents a meaningful sequence and the line helps readers understand how values change between observations.
However, connecting unrelated observations can create a misleading impression of continuity. If the goal is to investigate whether two numerical measurements are associated, a scatter plot is often the better choice.
What Is a Scatter Plot?
A scatter plot displays individual observations as separate points on a coordinate system. Each point represents a pair of numerical values, with one variable plotted on the horizontal axis and the other on the vertical axis.
Unlike a typical line graph, a scatter plot does not connect the observations. This allows readers to focus on the distribution of points and the relationship between the variables.
For example, a researcher might compare the number of hours students spend studying with their exam scores. Each student becomes one point, making it possible to observe whether students who study longer tend to achieve higher scores.
Common Uses of Scatter Plots
Scatter plots are particularly helpful for exploring relationships between two quantitative variables.
Common applications include:
- Comparing advertising spending with sales revenue
- Examining the relationship between height and weight
- Investigating study time and exam performance
- Comparing property size with selling price
- Exploring temperature and energy consumption
- Identifying unusual observations in experimental data
A scatter plot can reveal positive relationships, negative relationships, weak associations, and patterns that do not follow a simple straight line.
Understanding Patterns in a Scatter Plot
The arrangement of points can provide several useful insights.
A positive association occurs when larger values of one variable tend to accompany larger values of the other.
A negative association occurs when larger values of one variable tend to accompany smaller values of the other.
A weak or absent association appears when the points do not show a clear directional pattern.
Clusters may indicate groups with different characteristics, while outliers can highlight observations that deserve further investigation. These patterns help analysts decide whether additional statistical analysis is needed.
Line Graph vs Scatter Plot When to Use Each Chart
The main difference between these charts is the question they are designed to answer. A line graph emphasizes change across an ordered sequence, while a scatter plot emphasizes the relationship between two numerical variables.
| Feature | Line Graph | Scatter Plot |
|---|---|---|
| Primary purpose | Show change or trends | Explore relationships |
| Data arrangement | Ordered observations | Paired numerical observations |
| Point connection | Points are connected | Points remain separate |
| Typical horizontal axis | Time or ordered sequence | Numerical variable |
| Best for | Trends, fluctuations, progression | Correlation, clusters, outliers |
| Common example | Monthly revenue | Revenue versus advertising spending |
| Multiple series | Multiple lines can compare trends | Different symbols or colors can compare groups |
These differences provide a practical starting point when deciding which chart to use.
Choose a Line Graph to Show Change Over Time
A line graph is usually the better choice when the main question involves how a value changes from one period to another.
Suppose a website owner wants to review visitor numbers over twelve months. A line graph makes it easy to identify growth, seasonal fluctuations, and periods of declining traffic.
Choose a Scatter Plot to Explore Relationships
A scatter plot is generally more suitable when you want to investigate whether two numerical variables move together.
For example, a marketing team may compare advertising expenditure with the number of sales generated by each campaign. The scatter plot can reveal whether higher spending tends to be associated with higher sales, although it cannot establish causation on its own.
If your analysis focuses on time, trends, and progression, consider a line graph. If it focuses on association, distribution, and individual observations, consider a scatter plot.
Practical Examples of Line Graphs and Scatter Plots
Real-world examples make the differences between these charts easier to understand. The best visualization depends on the question being asked, even when the underlying subject is the same.
Example 1: Tracking Monthly Business Revenue
Imagine a small business records its revenue at the end of every month.
The business wants to understand whether revenue is increasing, which months show declines, and whether seasonal patterns appear. A line graph is a suitable option because the months follow a natural sequence.
The connected points show the direction of change and make fluctuations easier to identify.
A scatter plot would be less direct if the only goal were to display the monthly trend.
Example 2: Comparing Advertising Costs and Sales
Consider a company that records advertising expenditure and sales revenue for twenty campaigns.
The company wants to know whether campaigns with higher advertising costs tend to generate more revenue. A scatter plot is appropriate because each campaign provides a pair of numerical measurements.
The points may reveal a positive association, a negative association, or no obvious relationship. The company can then investigate campaign differences, audience targeting, and other factors that might influence the results.
Example 3: Analyzing Property Size and Selling Price
Real estate analysts often examine the relationship between a property’s floor area and its selling price.
A scatter plot can display each property as a point, with floor area on the horizontal axis and selling price on the vertical axis. This can help reveal whether larger properties generally sell for more, whether particular properties are unusually expensive, and whether the data contains distinct groups.
For readers exploring property market data and related analytical concepts, line graph vs scatter plot when to use provides a starting point for considering how different chart types communicate numerical information.
A line graph would not normally be the first choice for this comparison because property records are individual observations rather than consecutive measurements in a time series.
If the objective changes to tracking average property prices every month, however, a line graph becomes a more natural choice.
Example 4: Studying Temperature Changes
Suppose a weather station records the temperature every hour.
A line graph is suitable for showing how temperature changes throughout the day because the observations follow a chronological order.
If researchers instead want to examine the relationship between outdoor temperature and electricity consumption across many observations, a scatter plot may be more useful.
The same dataset can support different visualizations depending on the analytical question.
How to Choose the Right Chart for Your Data
Selecting an appropriate chart becomes easier when you start with the question you want the data to answer.
Identify the Main Question
First, decide what you want readers to learn from the visualization.
If you want to show how something changes over time, a line graph is often appropriate. If you want to examine whether two numerical variables are related, a scatter plot is usually a better fit.
Avoid selecting a chart simply because it looks familiar. The visualization should support the purpose of the analysis.
Examine Your Variables
Next, consider the type and structure of your data.
A line graph commonly uses an ordered horizontal axis, such as dates, months, or years. A scatter plot uses two numerical variables, with each observation represented by a pair of values.
Check whether the observations are naturally ordered and whether connecting them communicates a meaningful relationship.
Consider the Message You Want to Communicate
Think about what readers should notice first.
For example, a manager reviewing quarterly performance may want to see whether sales are rising or falling. A scatter plot showing each quarter as a separate point might still display the data, but a line graph would usually communicate the trend more clearly.
A researcher investigating the association between two measurements would generally benefit more from a scatter plot because it preserves the individual observations without implying that they form a continuous sequence.
Use a Trend Line When Appropriate
A scatter plot can include a fitted trend line to summarize the general direction of an observed relationship. This can make a pattern easier to interpret, particularly when there are many points.
However, the trend line should match the data and the purpose of the analysis. A linear trend line may not adequately represent a curved relationship, and an apparent association does not prove that one variable causes changes in the other.
Common Mistakes to Avoid When Using These Charts
Even a correctly constructed chart can be misleading if its design does not match the data.
Connecting Unrelated Observations
One common mistake is connecting individual observations that have no meaningful sequence. This can suggest a continuous progression where none exists.
For example, connecting the selling prices of unrelated properties in the order they appear in a spreadsheet does not reveal a meaningful trend. A scatter plot is more appropriate when comparing their prices with another numerical variable.
Confusing Correlation With Causation
A scatter plot may show that two variables are associated, but this does not establish that one causes the other.
Higher advertising spending and higher sales may occur together, for example, but other factors such as seasonality, pricing, and market demand may also influence sales.
Additional evidence and appropriate analytical methods are necessary to investigate causation.
Ignoring Axis Labels and Units
Every chart should clearly identify its axes and measurement units. Without labels, readers may misunderstand what the values represent.
A chart showing revenue should specify the currency, while a temperature chart should identify whether values are measured in Celsius or Fahrenheit.
Using Too Many Lines or Points Without Context
Multiple lines can make a line graph difficult to read, particularly when the series overlap. Similarly, a scatter plot with a large number of observations can become crowded.
Use clear labels, distinguish groups carefully, and consider smaller multiples, transparency, or other appropriate design choices when the chart becomes difficult to interpret.
Can You Use a Line Graph and Scatter Plot Together?
Yes. These visualizations can complement each other when an analysis involves both change over time and relationships between variables.
For example, a business may use a line graph to show monthly sales trends and a scatter plot to examine how sales relate to advertising expenditure. The first chart explains how performance changes over time, while the second explores a possible relationship between two measurements.
Researchers may also use scatter plots to inspect observations before fitting a trend line or performing regression analysis.
The important principle is to give each chart a clear purpose. Using multiple charts is helpful when each one answers a distinct question, but unnecessary visualizations can distract readers from the main findings.
Best Practices for Creating Clear Data Visualizations
Regardless of which chart you choose, a few design principles can improve readability and accuracy.
- Write a descriptive title. Explain what the chart measures rather than using a generic title such as “Data Analysis.”
- Label both axes. Include variable names and units where relevant.
- Choose an appropriate scale. Avoid axis choices that exaggerate or conceal important differences.
- Keep the design simple. Remove decorative elements that do not support interpretation.
- Highlight meaningful patterns. Use color or annotations selectively to draw attention to important observations.
- Provide context. Explain unusual changes, relevant time periods, or limitations when they affect interpretation.
- Check data quality. Look for missing values, incorrect units, and recording errors before creating the chart.
These practices help ensure that a visualization communicates the evidence accurately rather than simply making the data look attractive.
Conclusion
Understanding line graph vs scatter plot when to use comes down to identifying the purpose of your analysis. A line graph is generally best for showing changes across time or another meaningful sequence, while a scatter plot is better for examining relationships between two numerical variables.
Use a line graph to communicate trends, fluctuations, and progression. Choose a scatter plot to investigate associations, identify clusters, and examine unusual observations. When a project requires both types of insight, using the charts together can provide a more complete picture.
The most effective visualization is not necessarily the most complicated one. It is the chart that represents the data honestly and helps readers answer the question that matters most.
Frequently Asked Questions
When should you use a line graph instead of a scatter plot?
Use a line graph when your main goal is to show how a numerical value changes over time or another ordered sequence. The connecting lines help readers recognize trends and fluctuations.
When is a scatter plot better than a line graph?
A scatter plot is usually better when you want to investigate the relationship between two numerical variables. It helps reveal associations, clusters, and outliers without implying that the observations form a continuous sequence.
Can a scatter plot show trends?
Yes. A scatter plot can reveal a general upward or downward pattern, and an appropriate trend line can summarize the relationship. However, the pattern should be interpreted carefully because association does not necessarily indicate causation.
What is the main difference between a line graph and a scatter plot?
The main difference is how the data is represented and interpreted. A line graph connects ordered observations to emphasize change, whereas a scatter plot displays individual points to emphasize relationships between numerical variables.
Can the same data be shown in both a line graph and a scatter plot?
Yes. The same dataset can be visualized in different ways depending on the question. For example, monthly sales can be displayed as a line graph to show changes over time or as a scatter plot against advertising expenditure to explore a possible relationship.